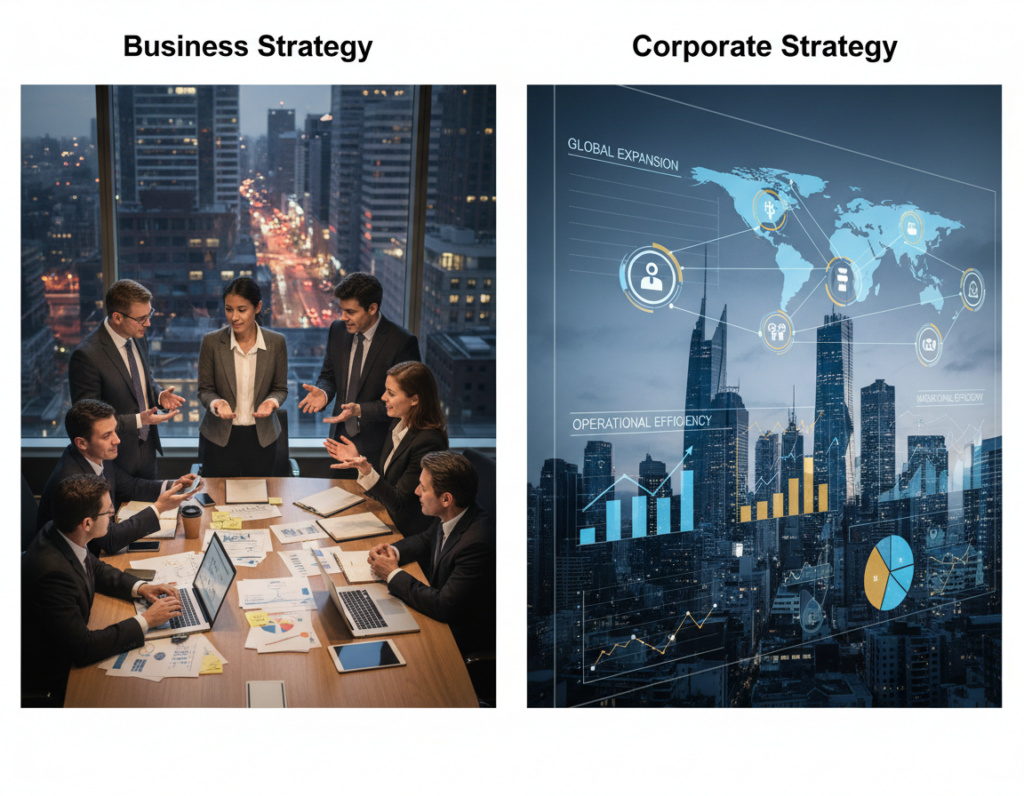
Can a company expand revenue and markets without drifting from its core priorities?
The answer matters for any business that wants to grow fast and keep teams aligned. This ultimate guide explains practical ways to scale while preserving execution cadence, priorities, and accountability.
Readers will learn what a strategic planning framework does, how to diagnose where scaling breaks down, and how to pick the right approach for market analysis, portfolio choices, and daily execution.
It is a curated set of proven tools — from SWOT and Porter’s Five Forces to OKRs, BCG, Balanced Scorecard, Ansoff, Blue Ocean, value chain and McKinsey 7S — shown with modern company examples.
The article moves from diagnosis to selection and application. It aims for decision clarity and consistent execution so teams spend less time debating and more time making measurable progress.
Preview: two practical tables follow — a framework selection matrix (use case → inputs → outputs) and a BCG portfolio action table to guide portfolio decisions.
Why scaling fails without a clear strategic framework
Scaling breaks down when execution and daily work drift away from leadership intent.
Leadership often sets direction, but the daily work in product, marketing, sales, and operations can diverge. This execution gap shows up as misaligned priorities and unclear measurable outcomes.
Execution is the bottleneck when strategy and operations are disconnected
As headcount rises, coordination costs and decision latency increase. Good plans stall because teams lack shared metrics and a repeatable decision process. 74% of companies report trouble executing their plan effectively.
What “losing focus” looks like in growing companies
Symptoms are easy to spot: too many initiatives, shifting quarterly priorities, conflicting roadmaps, duplicated work, and metrics that don’t tie to business results.
When a structured approach prevents drift across teams, products, and markets
Lightweight decision tools make assumptions explicit, create a shared language, and narrow options so teams act faster. They are not bureaucracy — they reduce wasted time and improve results by increasing accountability.
| Failure Mode | Observable Sign | Why it scales | Fix via structure |
|---|---|---|---|
| Execution gap | Roadmap vs. daily tasks mismatch | Ambiguity multiplies with headcount | Translate goals to measurable outcomes |
| Overload | Too many initiatives | Resource conflicts across teams | Limit priorities and align metrics |
| Slow decisions | Long approval cycles | Coordination overhead rises | Use clear decision rules and owners |
What a strategic framework is and how it supports sustainable business growth
A reliable planning system turns big ambitions into clear choices and measurable work.
Definition: A strategic framework is a simple, repeatable tool that guides one type of decision—diagnose, choose direction, allocate resources, execute, and measure.
It guides the lifecycle: first it helps create a clear plan by forcing choices.
Next, it drives execution by naming priorities, owners, and short-term objectives.
Finally, it builds evaluation with metrics and feedback loops so leaders can correct course.
The framework translates ambition into specific objectives and measurable outcomes.
Teams stop confusing activity with progress because each goal links to a leading indicator and an owner.
How alignment works in practice
Shared assumptions and a common vocabulary let different teams reference the same output — a SWOT grid, an OKR set, or a scorecard.
That standard output reduces debate and speeds decisions.
| Stage | Key Input | Output | Who owns it |
|---|---|---|---|
| Create | Market data, capabilities | Clear choices and priorities | Leadership |
| Execute | Priorities, owners, resources | Milestones and objectives | Product & Ops teams |
| Evaluate | Metrics, feedback | Course corrections and learning | PMO / Strategy team |
What good looks like: one strategic narrative, a small set of priorities, leading indicators, and a regular review cadence.
The best frameworks act as decision accelerators by defining inputs, outputs, and evaluation criteria up front. This protects focus as the company pursues steady business growth and long-term success.
Strategic planning models vs. frameworks and why the distinction matters
Leaders need a clear view of the whole plan and the tools that fill in its parts.
The “forest vs. trees” view
A model sets the high-level architecture — the “forest.” It shows how the plan’s pieces connect and where choices sit.
A framework focuses on a specific tree: it delivers detailed analysis or a decision output for one part of the model.
Tom Wright at Cascade describes this as an airport model (connections and flow) versus focused frameworks that optimize outcomes for a terminal or runway.
How teams combine multiple tools without busywork
- Use one model for the overall plan and pick frameworks to fill each stage: diagnose (SWOT), market (PEST/Five Forces), direction (Ansoff/Blue Ocean), portfolio (BCG), execution (BSC/OKRs), operations (value chain), org alignment (7S).
- Require a clear deliverable from each framework that informs the next decision. If it doesn’t, remove it.
- Standardize outputs so teams compare results quickly and the organization can act.
How to choose the right growth strategy frameworks for the situation
Choosing the right tool starts by naming the exact decision to be made.
Leaders should identify the decision first: enter new markets, win against competitors, shift the portfolio, or speed up execution. Match the method to the decision and the time horizon: near-term execution (weeks/quarters), mid-term bets (quarters/years), or long-term portfolio and capability work.
Right-fit signals: clear inputs, an output that teams can act on, and simple ways to share results across groups. If a process creates extra meetings without decisions, stop and simplify.
Common mistakes include running too many tools at once, treating outputs as slideware, skipping assumptions, and not naming owners for follow-up. A minimum viable stack is one diagnosis tool, one market analysis tool, one direction tool, and one execution system.
Selection matrix
| Use case | Required inputs | Recommended tool | Expected output |
|---|---|---|---|
| Market entry | Market size, customer needs, channels | PEST / Five Forces | Market attractiveness and entry risks |
| Competitive positioning | Competitor data, pricing, capabilities | Blue Ocean / Value Chain | Positioning choices and advantage levers |
| Portfolio decisions | Revenue mix, share, growth rates | BCG Matrix | Invest / hold / divest actions |
| Execution & cadence | Targets, owners, metrics | OKRs / Balanced Scorecard | Aligned objectives and measurable milestones |
Diagnose the current state before scaling efforts
Scaling safely begins with a clear, measurable picture of the company’s present health.
Baseline the business stage, market position, and constraints
Step 1: Measure revenue mix, retention, margin, CAC/LTV, pipeline coverage, and capacity limits.
Link metrics to the business stage: early product-market fit looks different than a mature company preparing to expand.
SWOT to separate internal and external factors
Strengths and weaknesses are internal; opportunities and threats are external. Require evidence for each entry — data, customer feedback, and win/loss notes.
Use this analysis to decide what to double down on, what to fix before scaling, what opportunities to test, and which threats to hedge.
Issue-based planning and gap analysis
Start with the biggest problems now (onboarding time, churn, support backlog). Prioritize by severity and impact.
Gap planning maps: vision → current state → gap → improvements. Quantify the gap and list root causes and actions that close it.
Practical flow:
- Baseline metrics
- Evidence-backed SWOT
- Prioritize issues
- Define gaps and fixes
Diagnosis prevents premature hiring or new launches. For tools that help choose the right analytical approach, see top strategic frameworks.
Understand the market and external forces shaping growth opportunities
Before picking a path, teams must map the outside forces that determine market appetite and risk.
Why external analysis follows internal diagnosis: internal work shows what the business can do. External analysis shows if customers, regulations, and competitors make those moves viable now.
PEST: map macro forces
PEST evaluates political, economic, social, and technological factors. For US operators, watch regulation shifts, interest-rate and inflation impacts on demand, changing buyer expectations, and automation trends.
Turn observations into implications. Example: if rates rise, then pricing tiers and payment terms may need adjustment. If automation accelerates, prioritize product features that integrate with new tooling.
Porter’s Five Forces: measure industry intensity
Assess rivalry, threat of entry, supplier power, buyer power, and substitution risk. Research market share trends, margins, pricing moves, supplier concentration, and alternative services.
Rate each force (low/medium/high) and tie the result to action. High barriers suggest protected margins; low barriers demand rapid differentiation and go-to-market speed.
Buyer power and substitution risk
When customers can switch easily or substitutes are “good enough,” pricing compresses. The response is tighter positioning, clearer value claims, and feature priorities that reduce churn.
| Analysis | Key Inputs | Strategic Implication |
|---|---|---|
| PEST | Regulation, rates, trends, tech | Adjust pricing, segment focus, feature roadmap |
| Five Forces | Market shares, margins, supplier/buyer data | Choose protected niches or speed/differentiation |
| Customer Power | Switching costs, alternatives, feedback | Emphasize unique value and lock-in features |
Deliverable: a one-page market thesis that summarizes forces, likely competitor moves, and where the business can win.
Pick a direction for growth across products and markets
After mapping capabilities and market forces, the next step is choosing where to place bets across products and markets.
Ansoff Matrix offers four clear options: market penetration, market development, product development, and diversification. Market penetration pushes deeper into current segments. Market development expands into new markets such as geographies or verticals. Product development builds new product features or modules for the existing base. Diversification pairs new products with new markets and carries the highest risk.
Compare risk and sequencing
Many companies lower risk by mastering penetration first, then moving to market development or product development once unit economics are stable.
| Option | Key risk | Core capability needed |
|---|---|---|
| Market penetration | Market saturation | Sales & retention |
| Market development | Distribution, regulation | Go-to-market & messaging |
| Product development | Product-market fit | R&D and support |
Use evidence to decide and consider Blue Ocean
Decisions should rely on customer research, win/loss signals, retention trends, and unit economics. If Five Forces show price pressure, apply Blue Ocean: find uncontested space by eliminating, reducing, raising, and creating features.
Outcome: a prioritized direction that matches capability, risk appetite, and clear metrics to test early-market assumptions.
Prioritize investments across the portfolio to avoid spreading resources too thin
A disciplined portfolio view forces choices so a company does not fund every appealing idea.
Why portfolio discipline protects focus: rapid market activity creates more opportunities than available resources. A simple model helps leaders trade off capital, headcount, and roadmap capacity.
“Trade-offs are not failures — they are how a business wins.”
BCG Matrix to decide where to invest, harvest, or divest
Estimate relative market share and market growth for each product or business unit. Directional accuracy matters more than precise percentages.
How market growth and market share influence allocation
High share in a high market implies invest to scale. Low share in a high market needs selective investment. Low market growth often funds other bets.

| Category | Action | Resource focus |
|---|---|---|
| Stars | Invest to win | Capital, top engineers, marketing |
| Cash Cows | Harvest to fund | Lean ops, product maintenance |
| Question Marks | Selective test or pivot | Small sprints, customer research |
| Dogs | Divest or minimize | Reallocate headcount, cut spend |
Governance tip: review the portfolio quarterly and tie moves to OKRs and scorecard measures so the operating system reflects these capital and people decisions.
Build an operating system for focused execution
Teams need repeatable routines that translate big plans into everyday work.
What the operating system contains
An operating system is the set of routines and artifacts that keep execution aligned: planning cadence, shared metrics, prioritization rules, and review meetings.
It makes the vision concrete and ties objectives to weekly work. Without it, goals drift and teams waste time on low-value tasks.
Balanced Scorecard and strategy mapping
Create a Balanced Scorecard by starting with vision, then define objectives for Financial, Customer, Internal Process, and Learning & Growth perspectives.
Pick measures that show progress, list initiatives, and assign action items with owners. A strategy map shows cause-and-effect—learning investments improve processes, which lift customer outcomes and drive financial results.
OKRs and practical guardrails
Use OKRs to track measurable outcomes. Write clear objectives and measurable key results. Keep KRs as quantitative outcomes, not task lists.
Limit OKRs to 3–5 per team per quarter. Use baselines and capacity to set ambitious but realistic targets.
| Perspective | Artifact | Owner | Cadence |
|---|---|---|---|
| Financial | Objectives & measures | CFO / Head of Ops | Monthly review |
| Customer | Customer metrics | Head of Product | Biweekly |
| Internal Process | Initiatives & actions | Engineering / Ops | Weekly standup |
| Learning & Growth | Skills plan | People / Growth PM | Quarterly |
How tools work together: the scorecard sets the system, the map explains why choices matter, OKRs define this quarter’s tests, and regular reviews create fast learning loops. Modern teams like Snyk and Pinterest use similar mappings and dashboards to focus lifecycle metrics and close feedback loops.
Strengthen the value engine that delivers customer value at scale
A reliable value engine shapes how a company consistently delivers to customers as scale increases.
Value chain analysis breaks the business into primary activities (inbound logistics, operations, outbound logistics, marketing & sales, service) and support activities (procurement, technology development, HR, infrastructure).
How to map and prioritize the work
Map primary and support activities and mark where value is created or lost.
Measure cycle time, cost per transaction, and defect rate to quantify bottlenecks.
Operational levers that unlock durable advantage
Improve onboarding, fulfillment, and support workflows to raise retention and referral. Fix handoffs, reduce rework loops, and close tooling gaps.
Lower cost-to-serve, faster delivery, and higher reliability compound into an advantage that is hard to copy quickly.
| Area | Common issue | Action |
|---|---|---|
| Onboarding | Long time-to-value | Automate key steps; measure TTV |
| Fulfillment | Late delivery | Streamline handoffs; add SLAs |
| Support | Repeat tickets | Root-cause fixes; knowledge base |
Turn analysis into 2–3 prioritized initiatives that feed the scorecard and OKRs. Validate each change with customer outcomes, not only internal metrics, to capture real opportunities and prove advantage.
Align the organization so growth doesn’t break teams, systems, or culture
As headcount and scope increase, the organization must be tuned or execution will fragment.
The McKinsey 7S Model offers a simple alignment lens. It checks seven internal elements: strategy, structure, systems, shared values, skills, style, and staff. Assess each S, then mark where mismatches exist.
Use the 7S as a diagnostic
Start by scoring each element for the current company state and the target state needed for scaling. Look for fast flags: a changed strategy with old systems, or new staff without skills development.
Where misalignment shows up
- Rapid hiring: inconsistent onboarding, unclear decision rights, duplicated roles, and managers optimizing locally.
- New product launches: roadmap ownership fights, support gaps, sales incentives misaligned with pricing, and missing metrics.
- Expansion into new markets: differing styles and shared values that fragment customer experience and slow execution.
“Fix structure, systems, and skills before doubling teams—otherwise costs rise and results fall.”
Outputs should be a short, prioritized list of 7S fixes: update planning systems, clarify product line structure, close skills gaps, and align incentives. Tie each fix to the scorecard and OKRs so the organizational design reinforces execution, not competes with it.
Conclusion
A compact set of choices keeps scaling focused, not scattered. The right mix of diagnosis, market analysis, direction, portfolio review, execution, operations, and org alignment turns ideas into measurable work.
Start small and be practical. A recommended starting stack: SWOT or issue-based diagnosis, PEST/Five Forces, Ansoff, a BSC/strategy map, and OKRs. Add BCG, value chain, and 7S as complexity rises.
Pick one near-term decision, run one framework to produce a decision-ready output, and link it to quarter-long goals and metrics. This strong, next step helps the team learn fast.
Over time, disciplined portfolio trade-offs and aligned org design compound into lasting success. Treat the plan as living content: revisit assumptions, track results, and iterate the plan as markets and capabilities change.